The V.A.M.P scale - measuring tone and thematic markers in vampire movies

Return home?
I really like data analysis and I really like vampire movies. I wanted a quick and snappy way to communicate the differences in tone between a few specific movies and I thought it would be funny to devise a scale. That's it.
Further V.A.M.P. scale backstory: it took me a little bit to devise how to depict the categories in a snappy way. The initial conception was as a percentage makeup, but I also considered a 4 quadrant graph. This got scrapped pretty quickly because I didn't want anything to be diametrically opposed; none of these categories are mutually exclusive. I also thought about a triangle graph with 3 categories, but I got really attached to the idea of 4 of them. The categories also had different names initially but I wanted a thematic and catchy abbreviation and GCMS just didn't have a chance.
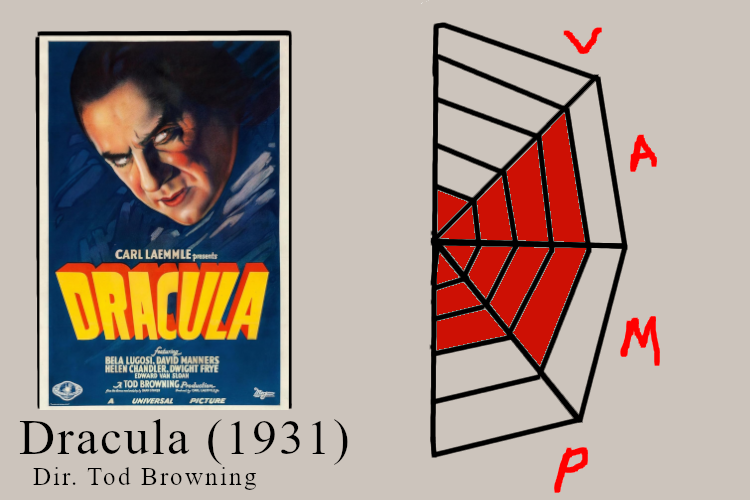
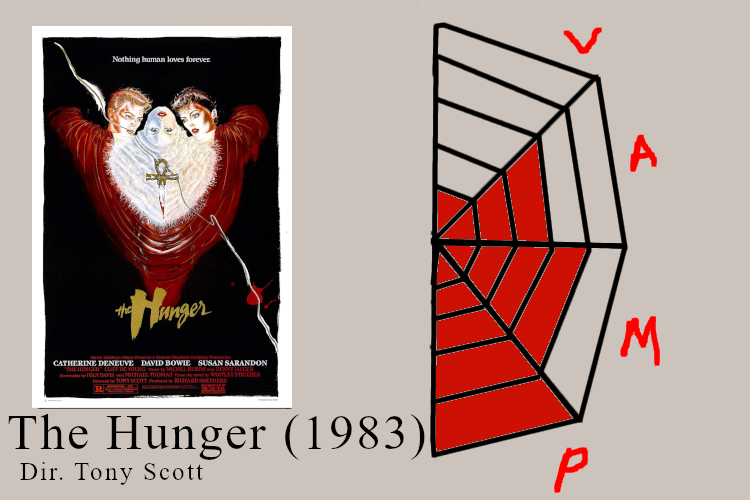
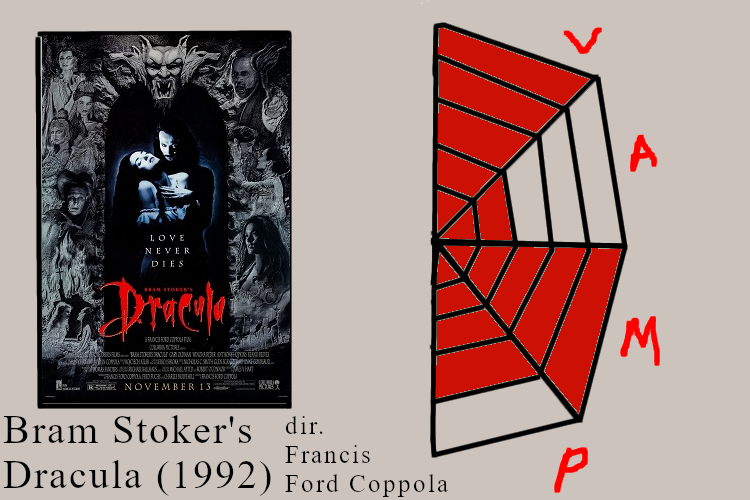
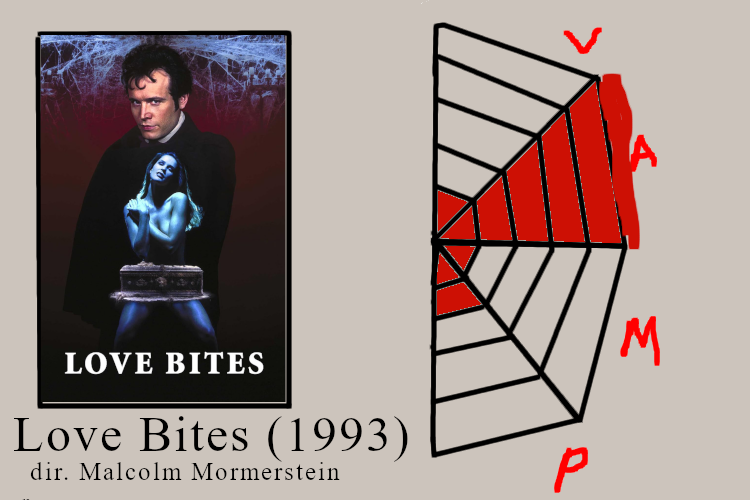
The central conception of the V.A.M.P. scale is that every single vampire movie has an atmospheric and thematic tone which incorporates at least 2 of these 4 categories to varying degrees:
Each rated film is graded in each of these categories on a 5 point scale, which is then represented as a radar graph. I usually stylize this as half of an 8 segment radar graph because it looks like a cobweb. Here at nuclearblues productions we like to keep things as thematic in presentation as possible.
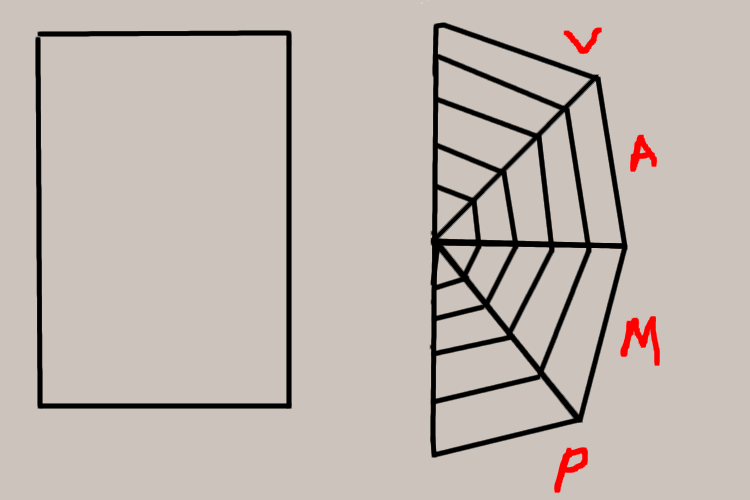
Please excuse any jank in my template, I made this in 10 minutes with GIMP and a trackpad. Maybe I'll make a nicer polished one someday, but I think it's perfectly serviceable for now!